> restart;
Affine Approximation
We expand on the notion that if a function has a derivative for a certain value of
![]() , then the tangent line at the point (
, then the tangent line at the point (
![]() ) is a good approximation to the graph of the function for
) is a good approximation to the graph of the function for
![]() close to
close to
![]() . Another way to put this is that if you expand the scale, as if you were looking at the graph under high magnification, the graph would look more and more like a line, and that line would be the tangent line at the point. This theoretical fact has important practical applications since it allows us to approximate a non-linear function
. Another way to put this is that if you expand the scale, as if you were looking at the graph under high magnification, the graph would look more and more like a line, and that line would be the tangent line at the point. This theoretical fact has important practical applications since it allows us to approximate a non-linear function
![]() near
near
![]() by a linear function.
by a linear function.
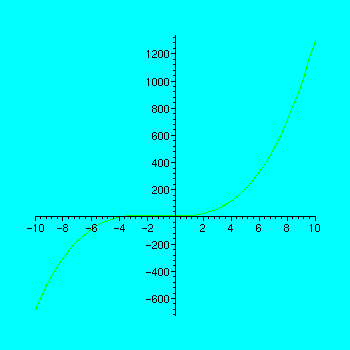
Start by defining a function
> f := x -> x^3 + 3*x^2 - x + 1;
![]()
> plot(f);
Maple allows us to find the derivative of this function by using the `D' operator
> D(f);
![]()
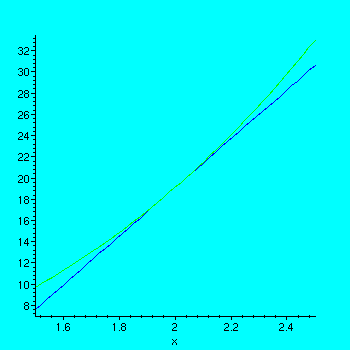
Let's pick a value of
![]() and a distance
and a distance
![]() so we can plot the graph of the function and the tangent line from
so we can plot the graph of the function and the tangent line from
![]() to
to
![]() .
.
> a := 2; h := .5;
![]()
![]()
The slope at (
![]() ) will be the value of the derivative at
) will be the value of the derivative at
![]() :
:
> m := D(f)(a);
![]()
So the equation of the tangent line will be
![]() . If we transpose the term
. If we transpose the term
![]() to the other side of the equation, this becomes
to the other side of the equation, this becomes
![]() . We may now plot both the graph of the function and the graph of the tangent line.
. We may now plot both the graph of the function and the graph of the tangent line.
> plot({f(x),m*x + f(a)-m*a},x=a-h..a+h);
>
Homework, Problem 1
. Go back to the command line where the values of
![]() and
and
![]() are set. First change
are set. First change
![]() , choosing a smaller value, say
, choosing a smaller value, say
![]() , and then reexectue all the following statements to see what happens to the graph. Try this for progressively smaller values of
, and then reexectue all the following statements to see what happens to the graph. Try this for progressively smaller values of
![]() and see that the graph and the tangent line become indistinguishable.
and see that the graph and the tangent line become indistinguishable.
Then go back and do the same thing for another value of
![]() , which is up to you. In the space below, enter the value of
, which is up to you. In the space below, enter the value of
![]() you chose, and a value of
you chose, and a value of
![]() for which the graph of the function and the tangent line were indistiguishable. Do you think that the two were really identical? That is, what would expect to happen if there were no practical limitations on resolution and pixel size? You may type your answers in as text if you figure out how or you may just write them in.
for which the graph of the function and the tangent line were indistiguishable. Do you think that the two were really identical? That is, what would expect to happen if there were no practical limitations on resolution and pixel size? You may type your answers in as text if you figure out how or you may just write them in.
>
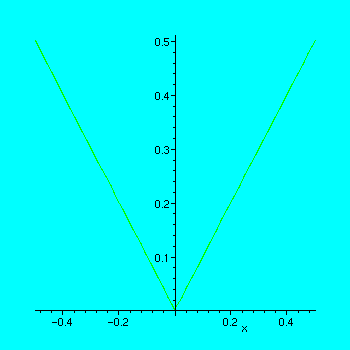
When there is no derivative at a point
If the function does not have a well defined derivative at the point, it won't look like a straight line no matter how much you magnify the scale.
> h := .5;
![]()
> plot(abs(x),x=-h..h);
>
Homework Problem 2 . Go back and change h to smaller values, and reexecute the plot statement. Does anything appear to happen to the graph as the scale is magnified? What does it look like?
>
Here is an even more bizarre example. First define the function
> g := x -> x + x*sin(1/x);
![]()
The expression on the right is not the defined at at
![]() , but we may define the function to be zero at
, but we may define the function to be zero at
![]() , and that is consistent with the graph.
, and that is consistent with the graph.
> h := .5; plot(g(x),x=-h..h);
![]()
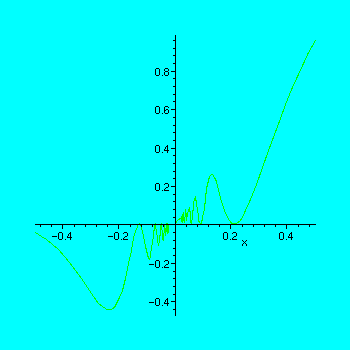
For your investigation
: Change
![]() to succesively smaller values in the above Maple command and reexecute the command. Note that no matter what the scale, the graph does not look like a straight line.
to succesively smaller values in the above Maple command and reexecute the command. Note that no matter what the scale, the graph does not look like a straight line.
>
A Surprise
If we modify the definition of the function slightly, we find that the graph behaves quite differently.
> g := x -> x + x^2*sin(1/x);
![]()
> h := .8; plot(g(x),x=-h..h);
![]()
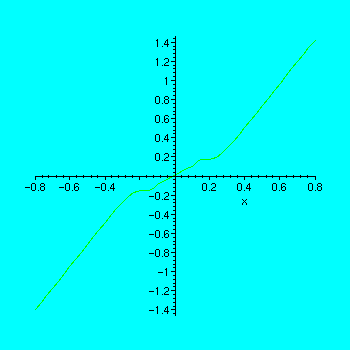
For your investigation
: Go back and change
![]() to succesively smaller values and reexecute the command to plot the graph. It should look more and more like a line, in fact, the line with equation
to succesively smaller values and reexecute the command to plot the graph. It should look more and more like a line, in fact, the line with equation
![]() . This function does have a derivative at
. This function does have a derivative at
![]() , and the slope of its tangent line is one.
, and the slope of its tangent line is one.